How we built the Metriql public demo

Burak Kabakci
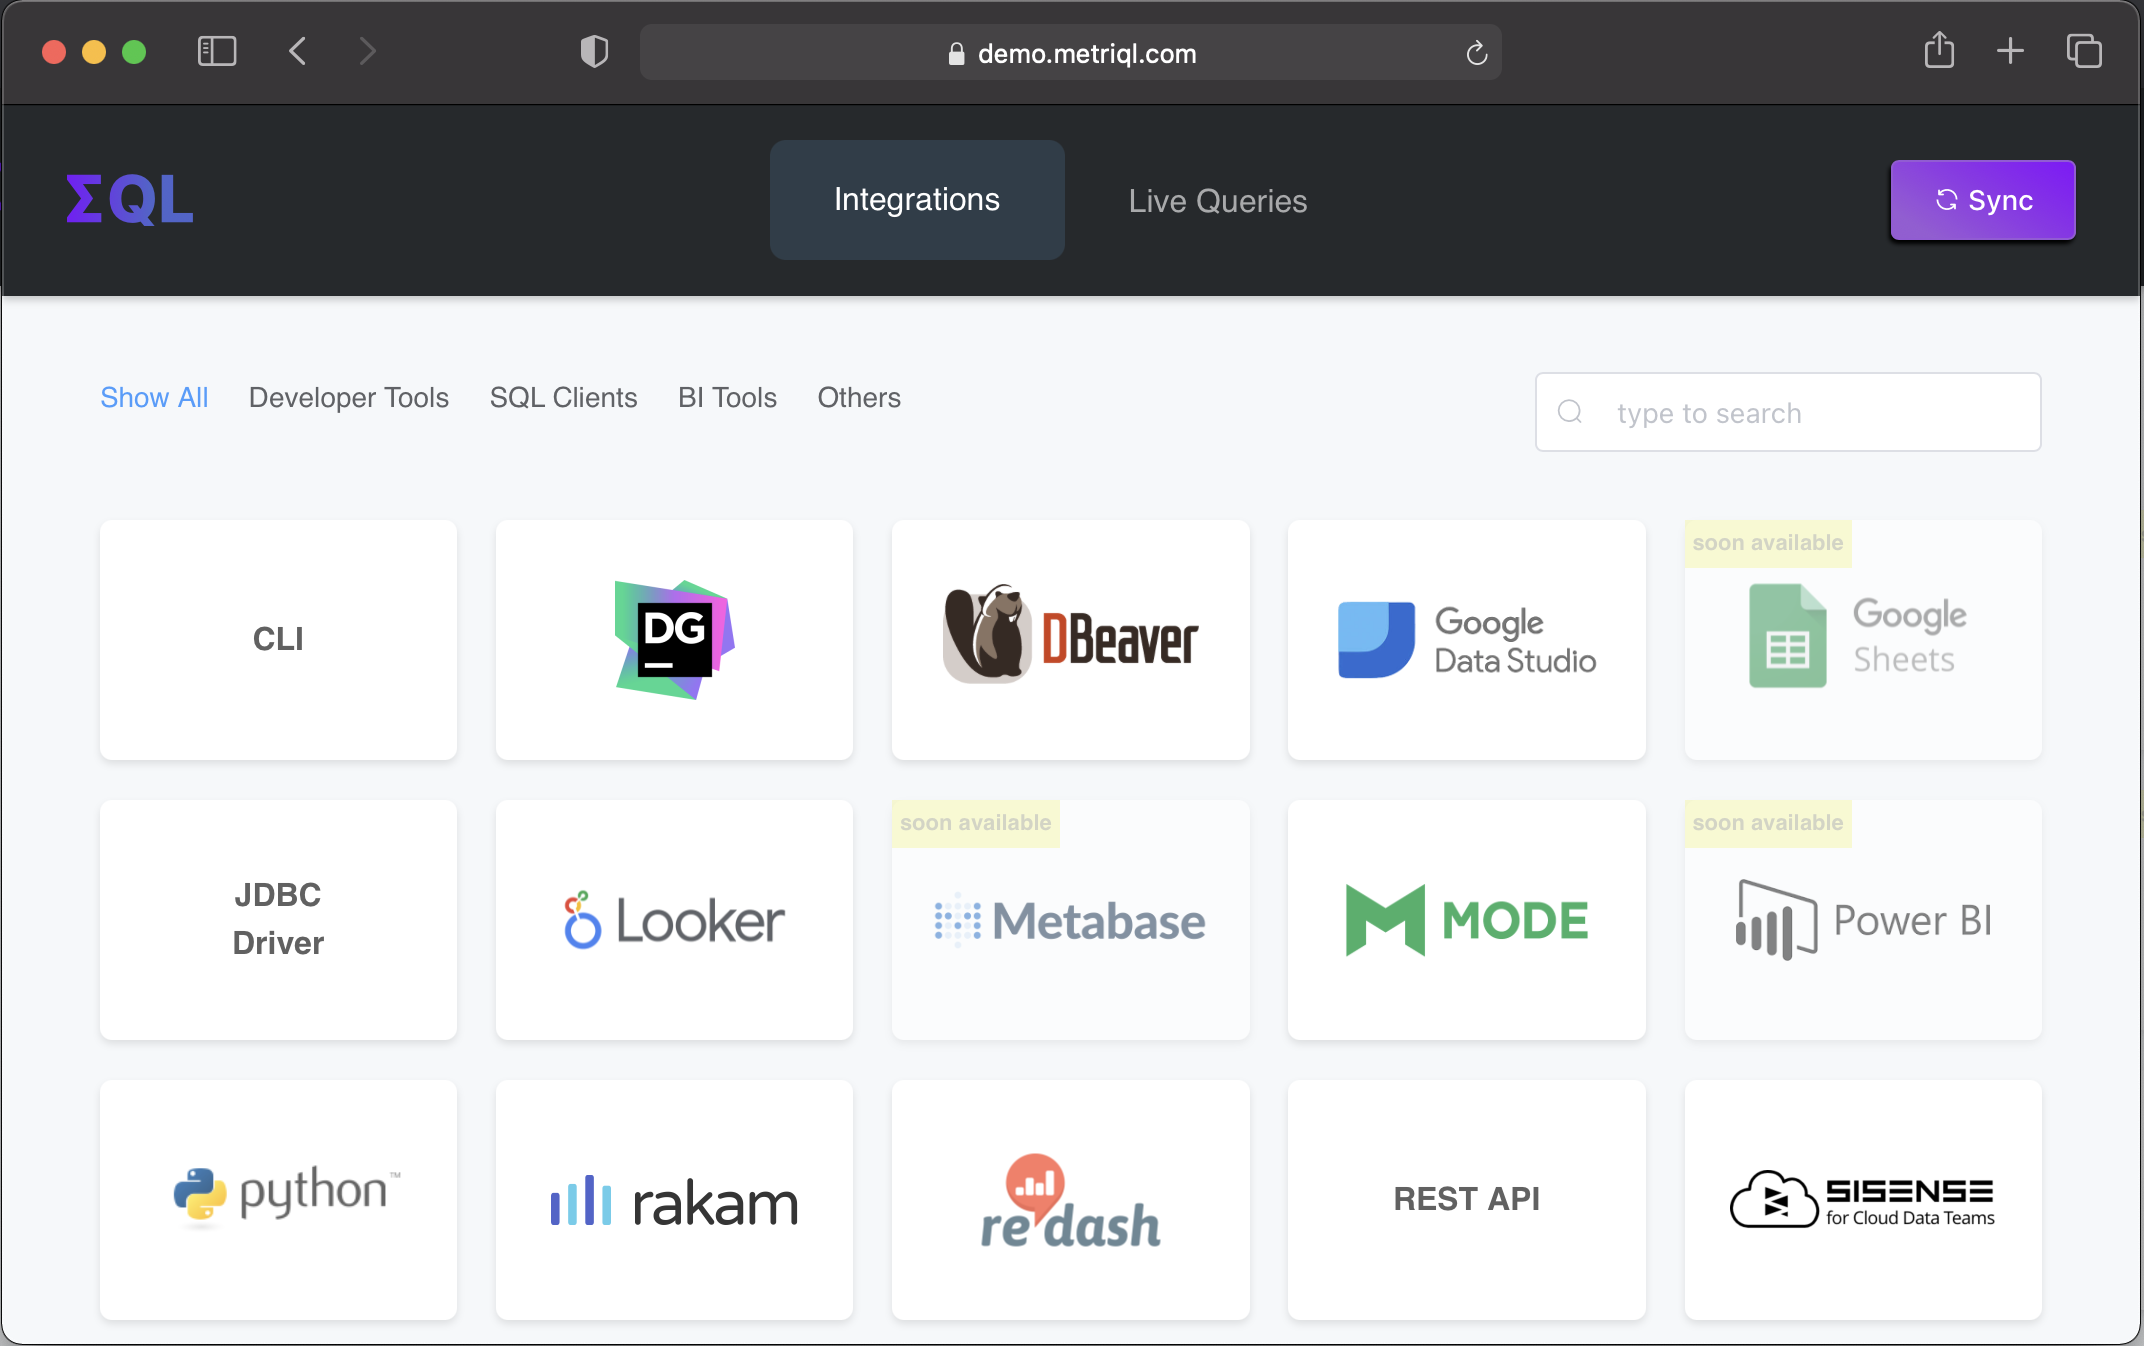
Core TeamMetriql doesn't have a user interface that lets you analyze the data because it's Headless BI. However, it comes with a dashboard that enables you to use the integrations that we have. Here is how it looks like:
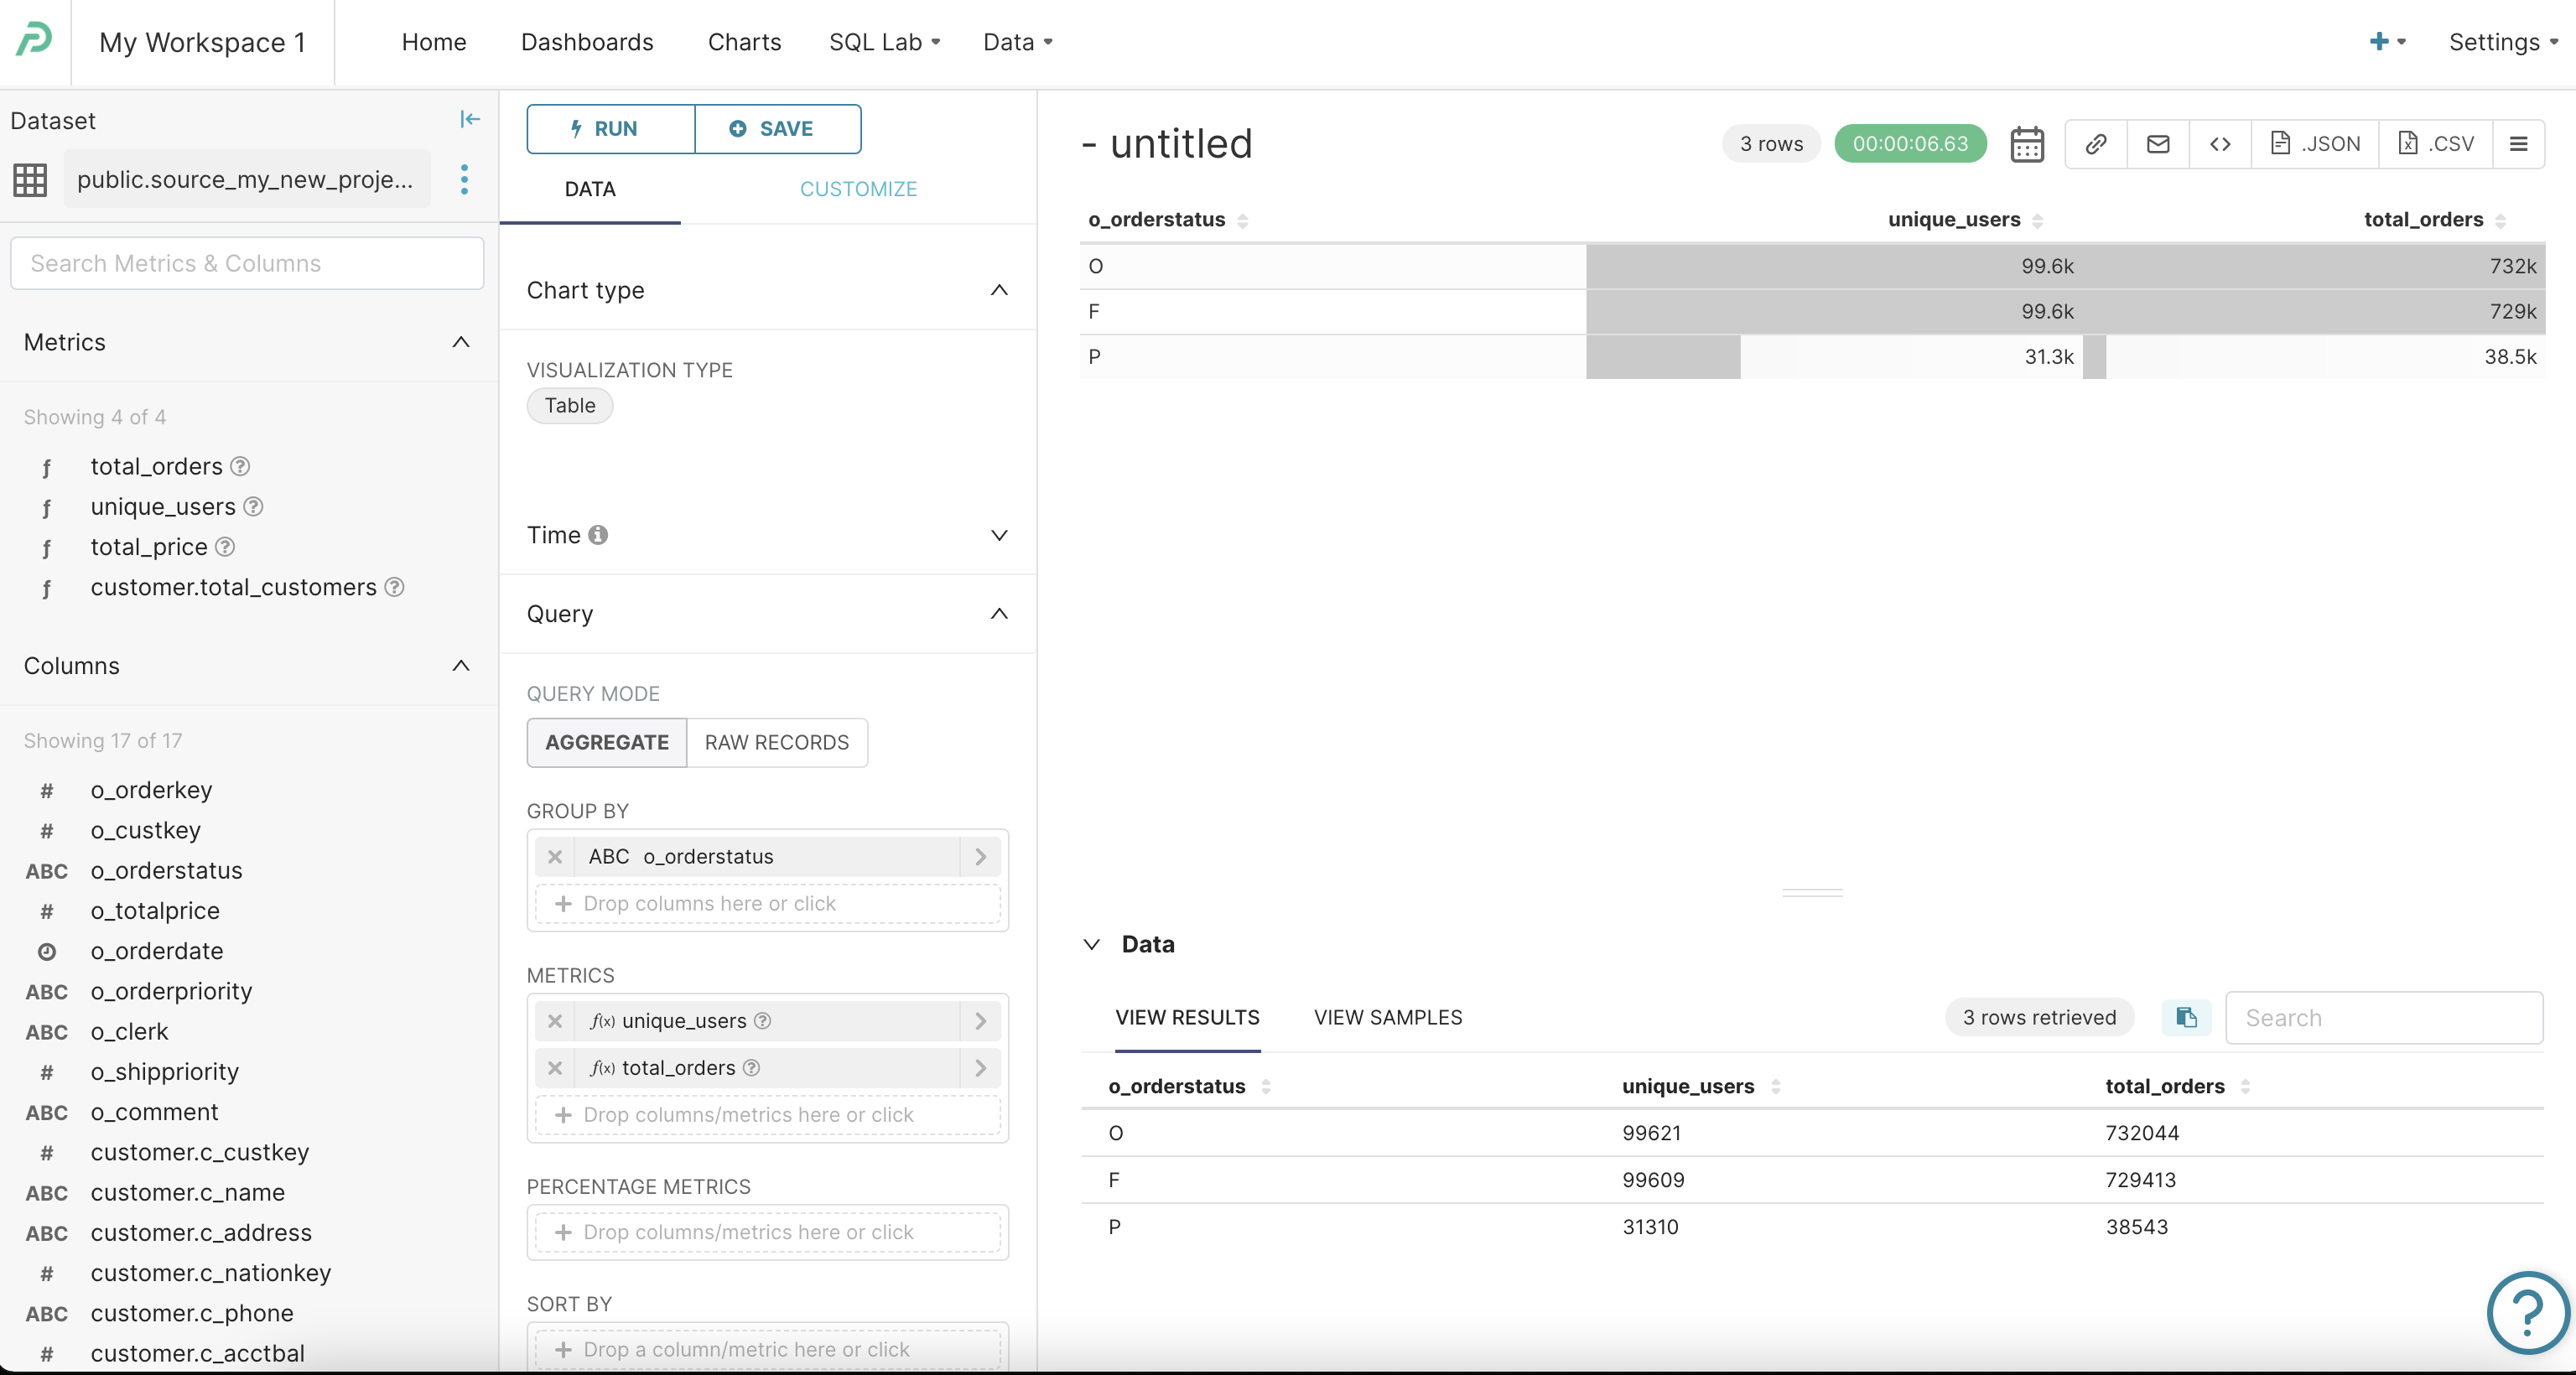
We built an open-source public demo that you can deploy to your Heroku, Google Cloud, or any cloud provider that supports Docker deployments. The demo makes use of two dbt seeds called customer and orders. We load the data into the database and define metrics with Metriql. It doesn't need to transform the data. Instead, it exposes the fact tables as Metriql datasets. Here is how it looks like:
version: 2seeds:- name: customermeta:metriql:measures:total_customers:aggregation: countcolumns:- name: c_custkey- name: c_namemeta:metriql.dimension:type: string- name: c_nationkey- name: c_mktsegment- name: ordersmeta:metriql:measures:total_orders:aggregation: countrelations:customer:to: ref('customer')source: o_custkeytarget: c_custkeyrelationship: many_to_onetype: left_joincolumns:- name: o_orderkey- name: o_custkeymeta:metriql.measure:name: unique_usersaggregation: count_unique- name: o_orderstatus- name: o_totalpricemeta:metriql.measure:aggregation: sumname: total_price- name: o_orderdate- name: o_clerk- name: o_shippriority
As you see, we have customer relation from the orders dataset, and we defined measures for both of our datasets. Our public demo uses Github Actions to run the dbt, wait for dbt to update the seeds, create the manifest.json file, and update the dbt Docs on Github Pages. Our manifest.json file is hosted here, and we pass the URL to Metriql container along with the profiles.yml file stored in repository secrets. Metriql updates the data models automatically once you push your code and wait for the continuous integration process to finish. After that, you can use your preferred data or visualization tool to analyze the data consistently.
Pro Tip: You can also use Scheduled Events in Github actions if you want to run dbt periodically. dbt Cloud works excellent for production environments, but it might be easier to run dbt as part of your continuous integration process that updates services such as Metriql.
If you're a SQL heavy user, feel free to run queries similar to this one using your favorite SQL client:
SELECT o_orderstatus, "customer.total_customers" FROM "ref('orders')"
Note that we don't allow aggregation functions or GROUP BY statements in MQL. The data model should be defined as code for the data tools to consume the data reliably. Metriql automatically generates the SQL query for the target data warehouse similar to the query below:
SELECT"model_my_new_project_orders"."o_orderstatus" AS "o_orderstatus",count(*) AS "customer_total_customers"FROM "orders" AS "model_my_new_project_orders"LEFT JOIN "customer" AS "model_my_new_project_customer" ON ("model_my_new_project_orders"."o_custkey" = "model_my_new_project_customer"."c_custkey")GROUP BY1
Metriql parses the MQL query sent from the data tools, creates a segmentation report under the hood, and compiles it to SQL query, and applies the projections. MQL should not have side effects such as using an aggregation function array_agg might cause the data-warehouse to be bloated. We should define the data model as code and expose relevant measures and dimensions to the data tools to analyze the data in different ways such as segmentation, funnel, and retention.
One more pro tip: If you want to create dimensional models automatically and speed up your queries, you can use Aggregates.
We do have native integration with Superset, which is the most popular open-source BI tool. Since Superset supports metric definitions already, our native integration uses your Superset credentials to update the datasets, the metric definitions, and the metadata. You can even add Superset related tags to your YML files as follows:
seeds:- name: customermeta:metriql:measures:total_customers:aggregation: countreport:superset:certification_details: buremba
Here is how it looks like:
You can deploy the public demo on your Heroku, Google Cloud, favorite cloud provider with one click. Please see the repository here.
Here is the 6-mins video of the full tutorial:
You visit the dashboard and connect Metriql from your favorite data tool, we have +16 integrations at the time of writing, and it's growing quickly! While we're working on integrating Metriql with most of the tools, eventually, we believe that We even got our first contribution from the data tool vendor, Seektable, thanks Vitaliy!
Promise, last pro tip: We will release a series of tutorials about how you can set up end-to-end analytics pipelines with different open-source data tools from data collection to visualization tools. Stay tuned! 🤞
We're also hiring!