Introducing Metriql: Open-source metrics store

Burak Kabakci
Core Team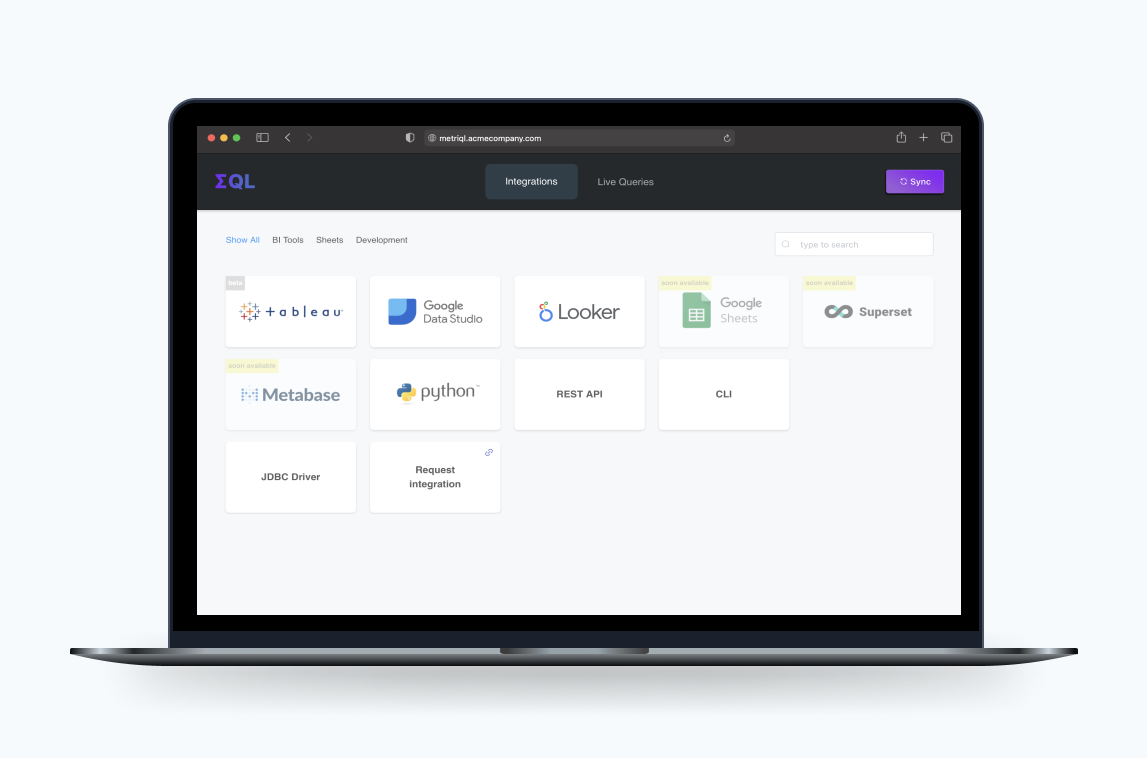
Today, most data-led/driven companies successfully establish the data warehouse as the single source of truth for their data and collect all their data into their data warehouse through ETL jobs. However, ETL is only one part of the whole process. Companies want to collect and own their data because they want to consume it in various ways to grow their business, whether by building analytical dashboards for stakeholders or building an ML application. To consume the data via BI or data tools, companies need to model their data and define business metrics and KPIs so stakeholders can agree on the definition of the data. Establishing the single source of truth for metadata is very difficult because tools and teams consume the data in different methods. This topic has also been addressed by many data folks recently: Ben has written The missing piece of the modern data stack, and Basecase came up with the Headless BI concept, Airbnb introduced Minerva.
We have also been giving careful thought to this particular problem for a while. The way we think about metrics is not just about the definitions; instead, better integration between data tools and data warehouses. Most companies already use a modern data warehouse and have adopted the data warehouse as the single source of truth. They ingest data in real-time, run ELT jobs directly in their data warehouse, run ad-hoc queries and get the results in low-latency, and even run ML jobs on them.
If you're using a data transformation tool such as dbt, you can model your data and expose it to your data tools, but that's not often enough for the data tools; we often found ourselves doing extra data modeling in data tools for metric definitions. This is because most of the data tools introduce different ways to define metrics, and you need to adapt them to be able to analyze the data reliably using these tools.
There are two major issues that most data teams run into when defining metrics in BI/data tools:
- You need to learn yet another expression language that's never flexible enough compared to SQL. (It must be compiled to SQL anyway)
- Since you usually need to use a GUI to define the metrics, it's not easy to automate, test, or share them with other data tools. (I'm not even talking about continuous integration and deployment)
Moreover, the problem is not just about the metric definitions. It's also about another buzzword everyone is talking about, self-serve analytics. If you aim to be one of those data-driven companies, you should enable all the people in your organization to analyze the data without any assistance from the data teams. To achieve that, depending on the organizational structure, you can either:
- Teach everyone SQL and have company-wide documentation for your data.
- Hire a data team, collect all the company data into a data warehouse, model the data for business requirements, and expose the data to the business stakeholders using their preferred tools.
It's not realistic to expect every company to have the luxury to teach SQL to all their stakeholders. Many departments such as product, marketing, and finance have different priorities and responsibilities and don't have time to invest in learning SQL. If you go with the latter approach, you usually need to use an ELT provider such as Fivetran, Stitch, etc., and adopt a data transformation tool such as dbt or Airflow for your company or stick with the data transformation features of your BI tool. You usually have the following two options with BI:
Go through the sales process and buy an enterprise product such as Tableau, PowerBI, etc.:#
Advantages
- Powerful visualization
- Ability to analyze the data much faster by extracting the data if your data source is slow
- Better community
Drawbacks
- Learning curve is too high
- Doesn't play well with the direct data sources
Stick with a free plug-and-play solution such as Metabase or Google Data Studio:#
Advantages
- Time to value is much shorter
- Easy to adopt non-technical people
Drawbacks
- Data should be modeled in advance
- Not flexible enough
Unfortunately, there is no one size fits all solution in the market. The enterprise solutions usually include all the components from data storage, transformation, and visualization, whereas plug-and-play solutions focus mainly on data visualization. The enterprise solutions have been around for the last 20 years, and a lot has been changed since then:
- Cloud Data Warehouses are efficient enough for self-serve analytics, so companies started to collect all their company data into data warehouses. (They can be expensive, but there are ways to optimize the cost)
- SQL became the de facto interface for querying data. (Even NoSQL solutions started to support SQL at some point!)
- As the data teams grow, the data transformation solutions have to evolve in a way that enables collaboration and automation. (Software developers invaded the data space just like what they did to DevOps)
Looking at these shifts, there is one enterprise-focused BI solution that we admire; Looker. We particularly like Looker because they foresaw this shift 7 years ago. Their data modeling language, LookML lets data analysts collaborate, test, and document the data and enable self-serve analytics for business stakeholders, all within SQL. It didn't even focus much on the data visualization (compare the customizations that you can apply to a chart in Tableau and Looker) because people only care about the data, not the fancy charts. Once you're sure that the data is correct, you can get insights even by looking at a boring table.
However, Looker is still an enterprise product like Tableau and PowerBI and tries to solve multiple problems simultaneously. Luckily, with Looker's wave, new data modeling tools have emerged, such as dbt Core. It's an open-source data transformation tool at its core, but you can also test and document your data, just like LookML. It's not comparable to LookML though; it has a much broader audience because it enables all the other data tools to use the generated data models in your data warehouse. It's not designed to be the serving layer, unlike LookML. With dbt Core, we believe that the data transformation layer is a solved problem, but the serving layer for your data is still missing. The data tools connect directly to the data warehouses
Metriql is LookML for all the BI tools in the market. You transform, test, and document your data with dbt, define your metrics with Metriql and serve data models to your data tools in a consistent way.
Metriql is an open-source project that lets you define your company metrics as code in a central metric store using dbt and later let you sync the data models to all your data tools at once.
Metriql sits between your data warehouse and the data tools. It doesn't have its query engine, instead it leverages your existing data warehouse. While it has a REST API, it's often not enough. The BI tools required a more tight integration, soo we built MQL, a SQL dialect for your Metriql datasets. We have native integrations with multiple tools such as Google Sheets and Google Data Studio and use Trino-interface for others such as Looker & Tableau.
If you don't have a standardized way of sharing the data across your organization and tools, each team ends up introducing their way of understanding the data, and it gets messy and painful to maintain, and this bears discussions like self serve is a problem. Our goal is to contribute to this self-serve problem by working on the standardization of the metric definition and distribution.
What we learned by working with data-driven and successful companies in the past years is that they use the right tool for the right job; they don't try to force one tool to fit all use cases. Today, BI tools are the front-end of companies' data, and teams want to choose and use any front-end depending on their use cases without worrying about vendor lock-in. While the Headless BI concept is relatively new and still in the early stages, it has many use cases that save data teams time and enable them to sync their data models to any data tool that their stakeholders and teams want to use. Happy and excited to be one of the first companies in this space! 🤞
We already released some Metriql integrations including Tableau, Google Data Studio, Looker, Python, Rest API. We aim to build integrations with other modern data stack tools as fast as possible and let companies sync their metrics with every data tool they are using. Happy to accept contributions, ideas or integration requests on GitHub and brainstorm about your use-cases on Slack!